Posted on: November 12, 2020 | 4 min read
Organizations leverage business intelligence (BI) to analyze their historical and present data to derive insights and predict future outcomes. A BI Solution has multiple phases and leverages people, processes, technology, and data. To launch an effective BI solution, you should first understand a BI architecture and analytics process.
BI Solution Overview
Business Intelligence (BI) refers to collecting, integrating, analyzing, and presenting business data. A BI Architecture is a framework of technologies and tools used to run a BI and analytics solution. Businesses can deploy a BI Architecture on the Cloud, on-premise, or even a combination of both. Still, in either case, there are a few common characteristics between all these scenarios. BI Architecture collectively supports the BI process's different stages, from data ingestion and storage to reporting and visualization.
There is no perfect formula for a BI architecture as there are many systems across sourcing, modeling, and presenting data. Below is a diagram that displays the four core areas of a BI Architecture.
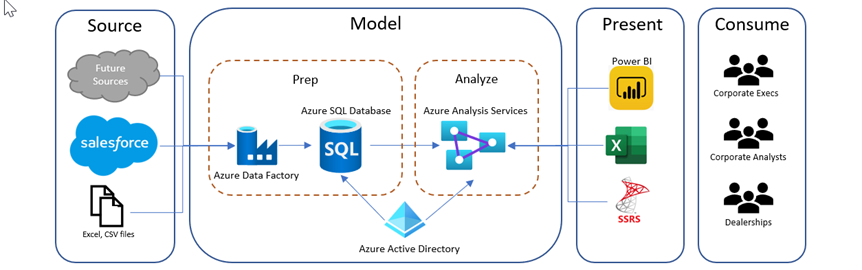
Source
- Source
Organizations can use various systems to capture and store transactional and operational data. These sources can be internal (CRM, Salesforce, ERP, etc.) and external (emails, excel, web), structured, and unstructured.
Model
- Extract, Transform, Load
To analyze data effectively, we need to consolidate it first. This process is called ETL, which stands for Extract, Transform, Load. After extracting data from different sources, we transform it to get a unified view of the data and then load it into the data warehouse (Azure SQL Database in our example). Another option is ELT (Extract, Load, and Transform), in which data is extracted and loaded as is and transformed later for BI use. Azure Data Factory is a managed cloud service built for complex hybrid ETL/ELT and data integration projects.
Enterprise Data Warehouse (EDW) is a database built for data analysis and reporting. It contains data extracted from various operational and transactional systems, internal and external sources, transformed to make the data consistent, and loaded for analysis. A data warehouse will help achieve cross-functional analysis, summarize data, and maintain one version of the truth across the enterprise.
- Data Model/Semantic Layer
A Data Model provides aggregated information and reduces a query’s response time compared to a relational database. Data Models are the layer between an enterprise data warehouse and reporting tools. In our example, a semantic layer (Azure Analysis Services) is a business representation of corporate data that helps end-users access data autonomously using common business terms. It maps complex data into familiar business terms such as product, customer, or revenue to offer a unified, consolidated view of data across the organization.
Present
Data visualization is a graphical representation of information and data. Using visual elements like charts, graphs, and maps, data visualization tools provide an accessible way to see and understand trends, outliers, and patterns in data. Knowing the story behind data makes data visualization a powerful tool for sharing and communicating information. There are many reporting and visualizing tools on the market. For example, Microsoft's SQL Server Reporting Services (SSRS), Excel, or self-service analytics tool Power BI.
Consume
Data analysis enables end-users to draw insights and support decision-making to gain information from data. Data-driven organizations focus on analytics adoption and enablement by getting the data in the hands of the users. During this phase of a BI Solution, end users can derive insights from the analytics and make recommendations that bring value to the business.
Read more about Overcoming Barriers to Analytics Adoption through this Whitepaper.
Written by CCG, an organization in Tampa, Florida, that helps companies become more insights-driven, solve complex challenges and accelerate growth through industry-specific data and analytics solutions.
Topic(s):
Data & AI
Return to Blog Home