Posted on: November 16, 2017 | 3 min read
Data science has become a key component of modern business intelligence practices. However, many organizations fail to realize the value of data science because analytic models created by data scientists are not widely adopted or applied to useful datasets. This may be obvious, but the utility of data science is dependent upon the actual use of the analytic models they are producing!
Historically, applying analytic models was easier said than done, because most were created on an individual's desktop and too often lived there through extinction. Advancements in cloud computing and storage now allows data scientists to create or replicate their work in a format that's easily shareable throughout the organization and applied in an actionable format. By leveraging modern cloud technologies like Microsoft Azure Machine Learning, data science models can easily be applied to existing data sets in an ongoing basis.
Let’s say that your data science team builds a churn model using a flat file data sample in Azure ML. How do you apply that analytic model to your existing customer data to make it actionable? If you already have an existing marketing dashboard in Power BI, you can overlay that churn model and visualize it in Power BI over your current data. Here’s how:
-
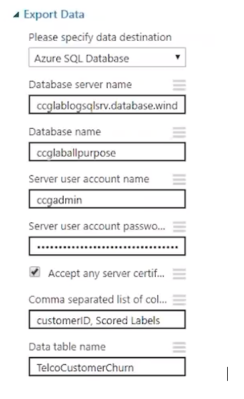
Setup output of ML experiment to Azure SQL Database table
-
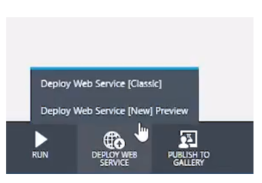
Deploy experiment to a web service so that it can be invoked outside of Azure ML
-
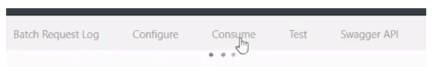
Select "Consume" menu in web services model page
-
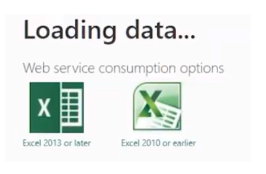
Click Excel button under "Web service consumption options" header to run the model in web service.
-
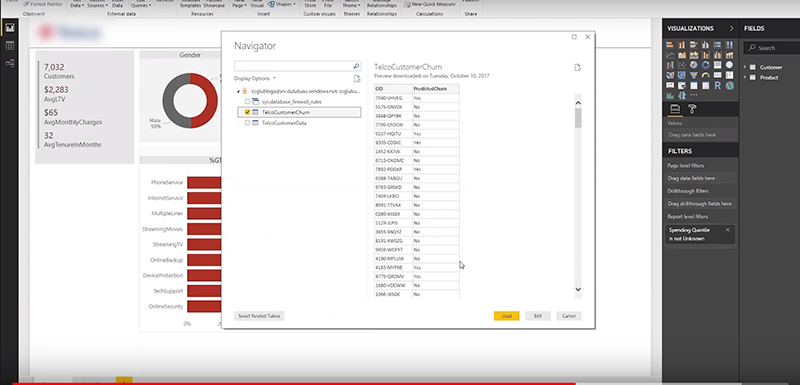
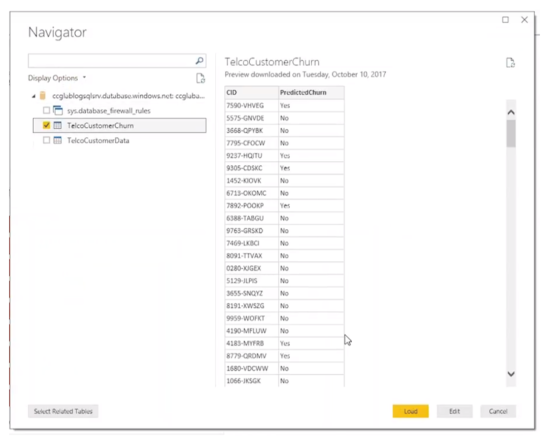
Connect to Azure SQL Database table by clicking "Get data" in the Home ribbon and select the ML Model Output.
-
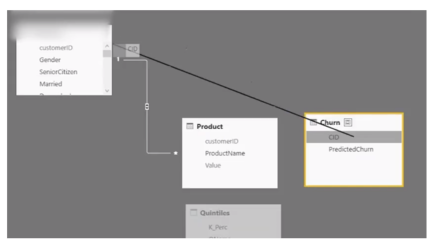
Establish the relationship in PowerBI between ML output table and existing sources.
-
Explore and visualize your data in PowerBI
After completing this simple exercise, you now have a web service based predictive experiment accuracy that can be invoked both inside and outside of the Azure environment. Through integration with an existing customer dashboard in Power BI, the true potential of this experiment can be fully understood. This model can be used to identify customers predicted to churn, group them based on demographics and purchase frequency, and provide insights for targeted marketing campaigns aimed at preventing churn. This dashboard even simplifies the process of contacting the customers through easy export of customer contact information to a CSV file.
Azure Machine Learning and Microsoft Power BI allow businesses to take immediate action on outcome prediction before the business environment changes. Azure’s automation options can programmatically call trained models rather than manually sending batches of data to a data scientist on an ad-hoc basis. And for the end user, the use of Power BI dashboards over data extracts manipulated in Excel greatly improves the ability, and accuracy of data exploration and visualization. Data governance is easily enforced over inputs and outputs of these analytic models by ensuring consistent data quality throughout the enterprise.
If you’ve struggled to find ways you can use machine learning for your business, or if the technology seems out of reach for your analytics and IT teams to handle, you’re not alone. Fortunately, with the tools available through Microsoft Azure, unlocking the value of machine learning may be much closer than you think. Learn more about driving innovation and growth with predictive and prescriptive analytics by clicking here or email an expert at info@ccganalytics.com.
Written by CCG, an organization in Tampa, Florida, that helps companies become more insights-driven, solve complex challenges and accelerate growth through industry-specific data and analytics solutions.
Topic(s):
Data & AI
Return to Blog Home