Posted on: March 12, 2020 | 6 min read

Get the Most from Your Power BI Investment
Microsoft Power BI has changed the way that business users and technologists alike can report, analyze, and process data. In this blog, we will walk you through the top changes to Power BI made in 2019, from new personalized visual pane improvements, to custom themes and KPI formatting. All updates are leading to one thing – an improved experience for your business intelligence needs.
Top Power BI Updates of 2019:
February
During February, there were some updates in the ways that the visuals interact with each other. There were also improvements to the analytics visuals. The four main updates that allowed for this were:
Visual Interaction:
- Cross-highlight on a single point in line charts
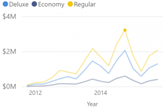
- Update Default Visual Interaction to cross-filter
Analytics Visuals:
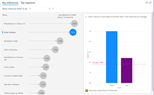
- Key Influencers Visual
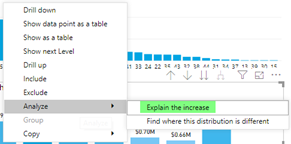
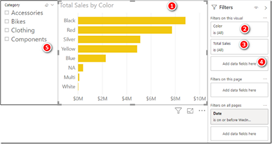
- Increase or Decrease Capabilities on Bar Charts
March
During March, the following notable updates were implemented:
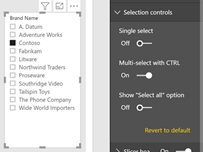
- Single Select Slicer: This was the first of two changes to the slicer visuals that were dropped in 2019. With this update, it allows the user to force a single selection rather than allowing only a control-click for multiple selections.
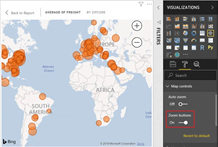
- Heat Map Support for Bing Maps- There was never a heat map option for Bing maps. Although RGIS is historically the preferable option, some occasional users prefer Bing maps. With that, it was important for Power BI to implement heat maps for Bing.
- Cross-Highlight by axis labels: You no longer have to hit on the bar to cross-highlight. You can now click on the axis label as well.
April
During April, the first of several changes to conditional formatting took place. The two most notable of the implementations were:
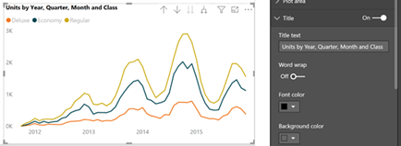
- Conditional formatting for visual titles
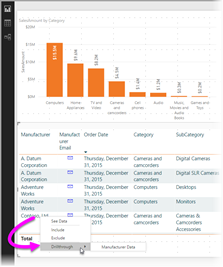
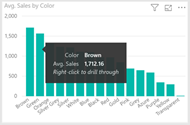
- Drill through across reports
May
During May, the following major updates were made:
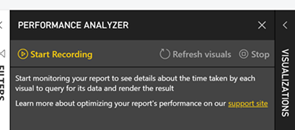
- Performance Analyzer Pain – This allows users to see how visuals are being taxed when they are loading. This is an excellent diagnostic tool for the performance of visualizations.
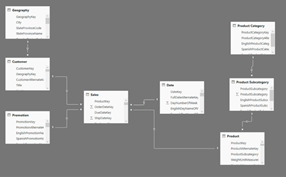
- Aggregations – You can now make a composite model that has direct query and import mode. This allows for large tables on direct query and aggregated tables in import with measures that can dynamically flip between the two. Therefore, if you’re outside of the tabular mode and want to create a report with a table that has over a billion rows in it, you can put that part in direct query and make an aggregate version in an import, and then use both simultaneously.
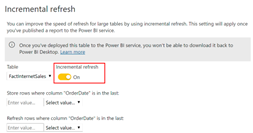
- Incremental Refresh – Before February of 2019 was only available for premium capacity but is now available for pro. Previously, users had to wipe and reload a full table with an import and refresh process. We can now incrementally refresh parts of the table.
June- August
Between June and August, the most notable enhancements to the Power BI platform were:
- Visual Level Filter for Slicer – This was an additional update to the visual slicer. You can now change the number of available options whereas before, you had to have the full set.
- Grouping Visuals- Similar to PowerPoint, you can now group visualizations together when you’re moving them.
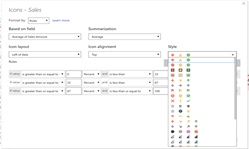
- Icon Set Picker- Similar to excel, you can create a set of icons that are conditionally formatted.
September
During September the following major updates were made:
- New Default themes
- Personalized Visualizations pane improvements- Change to ribbon where you can previews updates
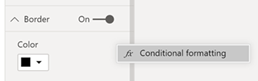
- Conditional Formatting for more visual formatting options- Border Color and Title Color
- Drill through - Alt text can preview the option to drill through
October - December
Between October and December, the most notable enhancements to the Power BI platform were:
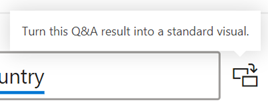
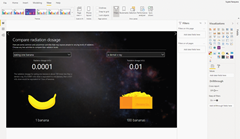
- New Q&A Visual – This allows the user to type in a Natural Language question and then generate a visual or table on top of it.
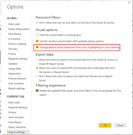
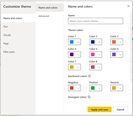
- Customize and Export Themes – You can now customize and export themes. Rather than having to edit the JSON file directly, you can now use the custom UI inside Power BI to do that. This allows the user to not only change the theme but make it your own.
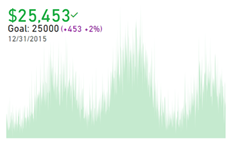
- KPI Formatting Settings – The user can now change more of the fonts, text color, and text sizes.
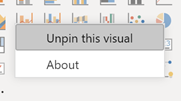
- Filter Pane Toggle – You can now turn it off enttirely if you need to have a little extra real estate in your report.
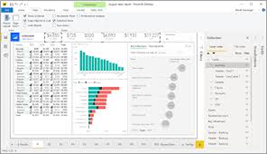
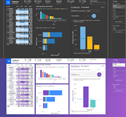
See it in Action
Business intelligence dashboards and data visualizations serve as a launching point for better business decision making. When enabling your organization with Microsoft Power BI it's crucial to stay up-to-date with their monthly updates to capitalize on your investment. For example, the ability to consolidate reports to single pan relieves time users spend alternating between tabs within the platform, and simplifies the look and feel to deliver value quicker. Interested in streaming how to view and use these updates in the actual platform? Click here, to have Senior BI Consultant, Andy Lawrence walk you through these updates in our recent video webinar.
Explore various use cases for Microsoft Power BI by exploring our recent customer story: Azure Agile Analytics Solution here or our blog: Take your BI investment to the next level with CCG, connect with a BI Consultant expert here.
Topic(s):
Data & AI
Return to Blog Home